Registering additional information in the Details window
Once you’ve designed your basic logical framework in the main window, you can complete it with additional information using the Details window in the bottom half of your screen. If this window is not visible, you can press the  button on the Lay-out toolbar.
The content of the Details window changes according to which cell you’ve selected in the main Logframe window:
- When you click on any of the goals in your logframe, you can complete general information about your project, such as its title, its starting date and end date (duration), information about your partners and other parties involved in your project (suppliers, donors, auditors…) and contact information.
- When you click on a purpose, you can identify the target group(s) and indicate the number of people (women, men) involved. You can also design the target group identification form here.
- For each output, you can identify key moments in the project, saying what should be achieved by when.
- For each activity, you can indicate when the activity starts, how long it will take, which other activity or event it will follow, how much time you will need to prepare, how long the follow-up period will be, how many times the activity will be repeated and who will be responsible for the execution.
- For each indicator, you can design how the indicator will be measured, using hard values, open ended questions, multiple-choice questions and so on. You can identify standard answers or limit the range of values that can be used.
- For each verification source, you can identify how the information will be measured, by whom and how regular.
- For each resource you have the choice between entering a global cost in the Budget column, or specifying multiple items in the Details window and calculate their total using their unit costs and if necessary the duration (for instance to calculate monthly wages).
- For each assumption, you can make a risk assessment and identify how you will respond should this risk materialise during the course of your project.
All this information is optional, you don’t have to fill out all these details if you don’t want to. However, if you want to print out additional reports, such as the project’s planning, the target group identification form, the Performance Measurement Framework (PMF) or the Risk Register, you will need to complete (at least a part of) this additional information.
Information about your project and partner organisations
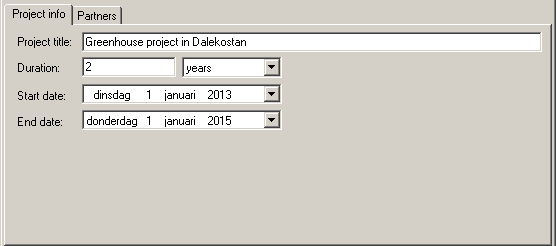
Click on any of your goals to show the Project information window. Here you can enter the title of your project and its duration. You can express the duration in days, weeks, months or years. Logframer will calculate the end date of your project when you change the duration (or modify the duration when you change the end date).
You should fill out the starting date and duration of your project before you start adding key moments to your outputs, or before you add the starting date and duration of your activities.
When you click on the Partners tab, you will see the list of partners (and other organisations that are involved in your project):
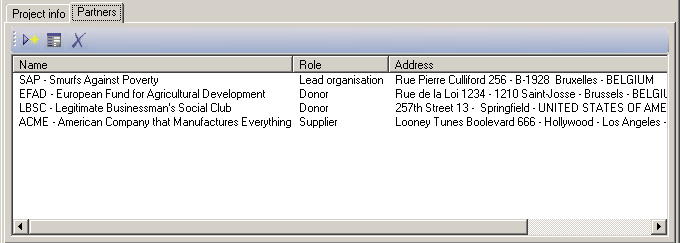
To add a new organisation to the list, click on the New organisation button  to open the following dialog window:
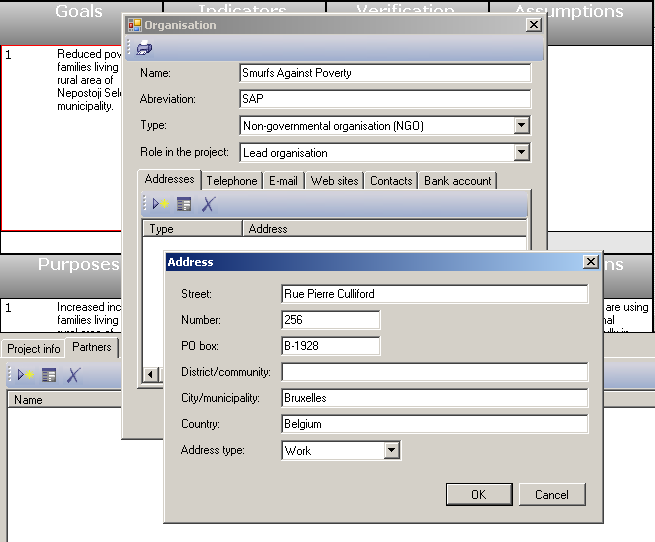
For each organisation, you can enter its name (and abbreviation) and indicate what kind of organisation it is (NGO, company, bank, medical institute…). You can also indicate the role that this organisation will have in your project:
- Lead organisation
- Partner
- Implementing partner
- Donor
- Financial institution (bank)
- Supplier
- Service provider
- Auditor
- Network
- Other
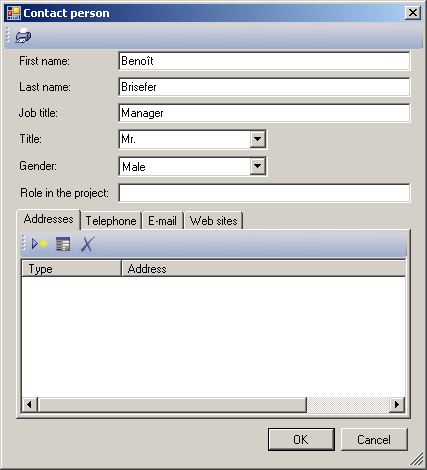
On the different tab pages below, you can register other information, such as the organisations address(es), telephone numbers, e-mail addresses, websites and financial information (bank accounts). Finally, you can also register information about your contact persons, including their addresses, personal telephone numbers and e-mail addresses, and their website address.
Identification of your target groups
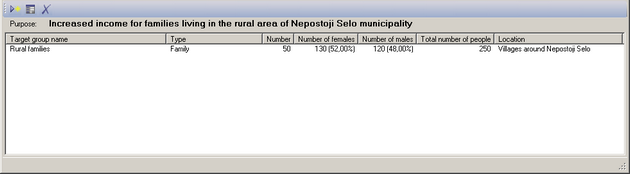
Click on a purpose to show the list of Target groups. This list gives you an overview of the target groups and the number of people that are concerned, as well as their location.
To add a new target group to the list, click on the New target group button to open a dialog window:
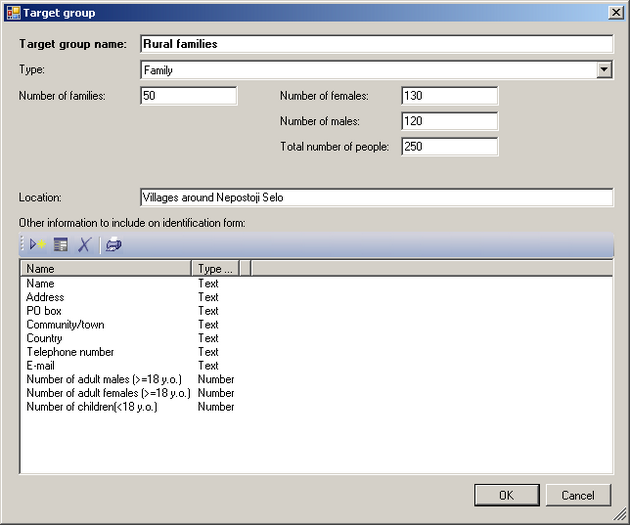
The second field allows you to select the type of target group you’re working with. You can select between the following options:
- Individual
- Family
- Extended family
- Community
- Association
- Enterprise
- Local authority
- Authority
- Other
Depending on the choice you make here, Logframer will add a list of suggested items for the list of information to include on the identification form (the list on the bottom of the dialog window).
You can modify this list by adding or removing fields. When you’re ready, you can push the printer button to get a preview of the Target group identification form, ready to print out. This form then can be used to identify individual people, families, organisations and so on in the field.
Identifying key moments
Click on an output to show its list of key moments. You can identify any number of key moments for each individual output.
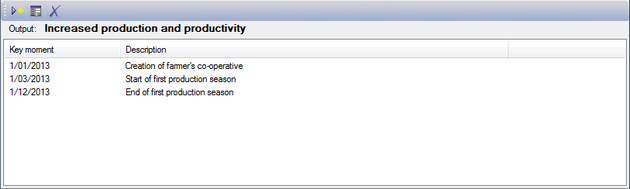
The key moments are sorted by date. If you want to reverse the sort order, you can click on the column header of the first column (or click on the Description header if you want to sort them alphabetically for instance).
To add a new key moment, click on the New key moment button to open a dialog window:
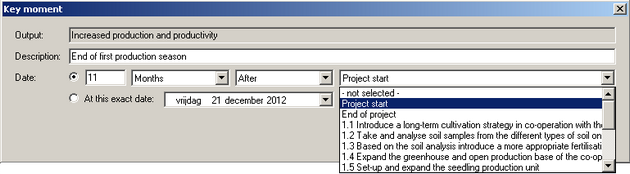
Here you can name the key moment, and set a date. You have two options to set a date:
- Select a date relative to another key moment, such as the start of the project, its ending or one of the activities.
- Select an exact date.
Selecting a date relative to another moment is practical in case you have to change dates in a later stage. For instance, if your project starts six months late, you only have to change the starting date. All dates relative to the starting date (directly or indirectly because they in turn are linked to a date that is related to the starting date) will then change.
In the Planning overview, key moments are indicated by a red diamond (rhombus).
Planning an activity
When you click on an activity, you can view or complete any related planning information.
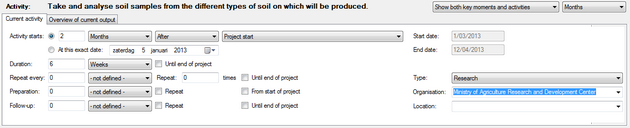
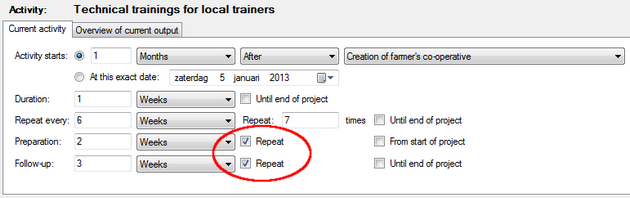
Setting the starting date and the duration of an activity
First you have to determine the starting date of the activity. As with key moments, you have the choice between a date relative to another activity or key moment, or an exact date. The advantage of a relative date is that you can make clear that the first activity has to end before the second one can start (because you need the results of the first activity as an input for the second one). For instance, you want to cultivate new crops. But before you can start planting, you need to analyse the composition of the soil, to make sure your new crops will grow in that particular kind of soil. So the planting can't start before you have the results of the soil analysis. If the analysis takes longer, the planting moves forward in time too. You can achieve this by using relative dates:
- Insert the number of days/weeks/months in the first field.
- Select the time unit. You can choose between minutes, hours, days, weeks, months, trimesters, semesters or years.
- Select whether this activity will start before or after the other activity.
- Select the activity or key moment to which you want to make a reference. You can choose from any key moment or activity that you've defined, as well as the project's start or ending.
Alternatively, you can select any specific date using the date selector on the second line.
Next, you can determine the duration of your activity, in minutes, hours, days, weeks, months, trimesters, semesters or years. If you want the activity to continue until the end of your project, first select the duration unit, and then check the Until end of project box. Logframer will then calculate the number of days/weeks/months... until the end of the project.
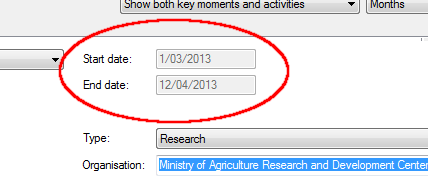
Once you've set the starting date and the duration of your activity, you can verify the exact starting and finishing date of your activity to the right.
Repeating an activity
You can repeat an activity any number of times. First, set the interval at which you want to repeat the activity. In the example below, we'll repeat the activity every six weeks.
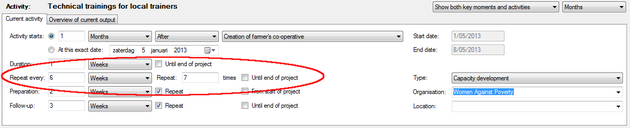
Next, you can determine how many times you want to repeat the activity. If you set the Repeat value to 1, the activity will show up two times in your planning: the original activity and then the one repeat. When you set this value to zero again, the activity will not be repeated.
When you check the Repeat until end of project box, Logframer will calculate the number of times you're activity will be repeated until the end of the project.
Setting the preparation time and the follow-up period
You can indicate how much time you will need to prepare for your activity using the Preparation field. Below, you can determine how much time you want to dedicate to follow-up your activity.
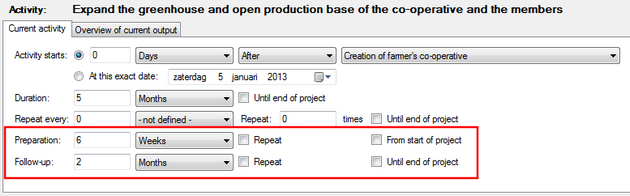
If you have a repetitive activity, the Repeat check boxes allow you to choose whether you'll only need the preparation or follow-up time for your original activity, or every time you're repeating it.
For instance, if you want to do a series of presentations, you may have to prepare a document or Powerpoint presentation once, before the first presentation. The next time, you won't need any time to prepare. However, if you're in charge of the logistics of a series of workshops, you may need a day of preparation time before every workshop, to set up the sound system, arrange the chairs, clean the room, etc. In such a case, you may want to use the Repeat option.
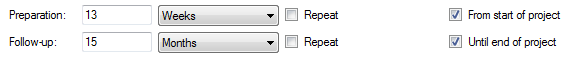
Using the From start of project option, you can indicate that the preparation time will run from the start of your project until the beginning of your activity. Logframer will calculate the number of days/weeks/months... you have until then.
Similarly, you can extend the length of your follow-up period until the end of the project by checking the box to the right.
Other information about the activity
Selecting the type of activity
Using the Type field at the right, you can indicate what kind of activity you're dealing with. You can select from a large number of options, including: Planning, Reporting, Monitoring, Registration of beneficiaries, Procurement, Meetings, Travel, Construction, Research, Distribution, Humanitarian Assistance, Capacity Development, Raising awareness, etc.
Who is responsible for the activity?
The Organisation field allows you to select which partner organisation or contractor will be responsible for the execution of the activity. You can select any organisation from your Partners list.
Where will the activity take place?
Use the Location box to indicate where the activity will take place. You can insert any new place, or select a place where you've previously organised an activity from the drop-down list.
Getting an overview of the activities of the current output
When you have a number of activities, some of which are linked to others and some of which may need preparation time, or follow-up afterwards, or may have to be repeated, it can become difficult to keep track.
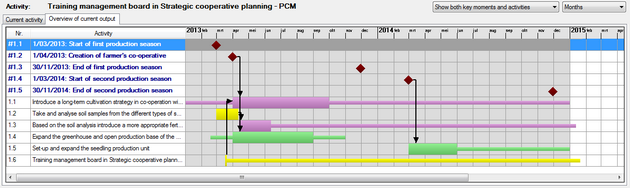
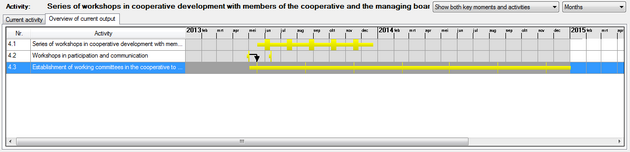
When you click on the Overview of current output tab, you will get an overview of all the activities of the current output in the form of a Gantt-chart.
The two drop-down lists at the top right allow you to manipulate the view of this Gantt chart.
- You can choose to see the activities only, or both the activities and the key moments that you have identified for this output.
- You can change the level of detail to days, weeks, months or years.
On the left, you can see the list of key moments (shown first in blue) and activities. On the right, you can see the actual Gantt chart:
- The duration of each activity is shown as a horizontal bar. The activity itself takes up the whole height of the row (thick part). The preparation time and the follow-up period are shown as thinner lines before and after the activity itself.
- Each type of activity has another colour (here purple is related to planning, green is construction, yellow has to do with capacity development)
- The black arrows show which activities are linked to key moments (the red diamonds), or to other activities.
Alternatively, if you want to have an overview of the activities and/or key moments of all the outputs - or in other words the complete planning of your project - you can open the Planning window.
Setting the type of indicator and how it will be measured
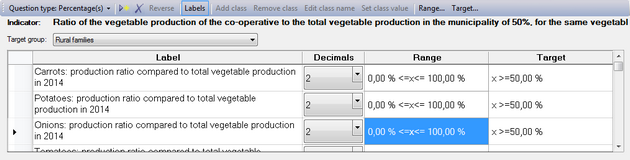
Click on an indicator in the logframe to see the Indicator detail window at the bottom of your screen. The content of this window depends on the type of indicator (the question type). On top you can see the Indicator toolbar, with the text of the indicator repeated in bold underneath. On the next line, you can choose to which target group this indicator applies. Finally on the bottom there is a table where you can design the details of your indicator.
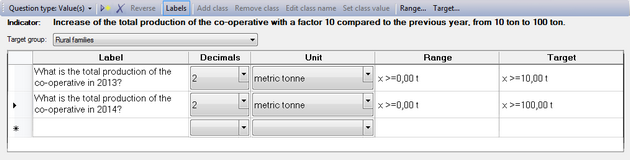
This table at the bottom allows you to work with compound indicators, or indicators that are made up of a series of questions that bring together the information you're looking for. Alternatively, you can also specify different targets for different years - as in the example above.
If you want a simple indicator, you can just fill in the first line of the table.
The Indicator toolbar

Basic functions:
- To change the type of question/indicator, use the
 button in the toolbar.
 - To add a response to the table, you can click on the
 button in the toolbar. Alternatively, you can simply go to the bottom row of the table and enter your text there.
 - To remove a response from the table, click on the
 button in the toolbar.
 - You can show or hide the labels column(s) by clicking the
 button.
 - For certain types of indicators, you can add responses in the form of columns (for instance for a multiple choice question). These options are referred to as classes and there are three buttons to manipulate them:
- The Add class button

- The Edit class button

- The Remove class button

- The Add class button
- When you work with values (or percentages), you can limit the range of values that people can use, using the
 button.
 - For many types of indicators, you can indicate the
 range , either as values or percentages, or else as a part of the population (also in percentages).
Question types
Logframer allows you to choose from a whole range of indicator types:
- The open ended question
- Registration of values or percentages
- Multiple choice questions, multiple options questions
- Yes/no-questions
- Ranking questions
- Best/worst scaling (maximum differential)
- Preferential scales where the respondent has to indicate his preference on a number of options: Thurstone scale, Summative scale (Likert), Cumulative scale (Guttman)
- Semantic differential
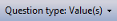
Open-ended questions
The advantage of an open-ended question is that it allows people to express themselves freely, thus providing you with information that you might not have found otherwise. Open-ended questions are also interesting to get information about how a person feels about something. Often, the answers you get are more objective than direct or closed-ended questions.
Typically, open-ended questions start with 'Why...', 'How...', 'How do you feel about...' and so on.
The disadvantage of open-ended questions is that by definition, the replies are not standardised. This means that collecting, treating and analysing the information can be more complex, especially when you interview a lot of people.
In terms of the logical framework, open-ended questions are interesting to measure outcomes (expected or unexpected effects; wanted or unwanted effects) and impact (expected or unexpected; wanted or unwanted).
You can enter one or more questions in the 'Label' column of the table. In the 'White space' column you can set how much space the respondent or the interviewer has to note down the answer. This way you have some measure of control to the length of the answer. The amount of white space can vary from 1 to 7 lines, or from a quarter page to a full page.
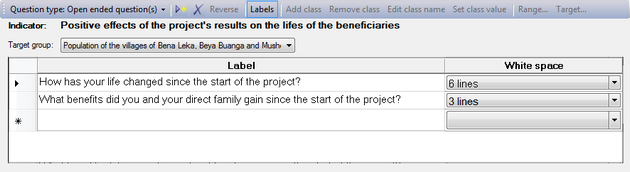
Registration of values or percentages
In many cases, you will want to register hard data in the form of absolute values. Often, Objectively Verifiable Indicators are seen as synonymous to numbers, however this needn't be the case. Also take into account that numeric indicators may look good on paper, but may be very difficult to measure in practice. In many countries, statistics are notoriously hard to get by, and people are far less 'number-oriented' than in highly developed societies, where everything is measured and everything has got a price.
- In the 'Label' column, you can specify your question(s).
- The 'Decimals' column allows you to specify to what degree of exactitude the value has to be measured, i.e. the number of decimals behind the decimal point/comma.
- You can specify the unit of your values using the drop-down list of the Unit column. You can choose from a wide range of metric units, US customary units, time units and others. If you can't find the unit you need, simply type it into the field and it will be added to the list as a user-defined unit.
Setting a range
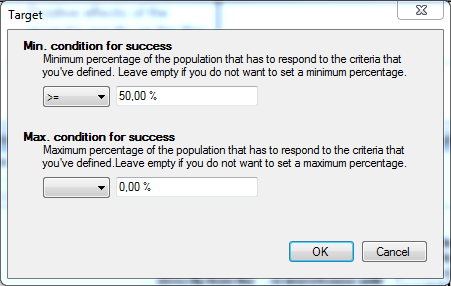
If you want to set a limit to the values that should be registered, you can identify a range. When you click on the button, you will get a pop-up dialog that allows you to set the bottom value and top value of the range. You can also double-click on the cell to open this dialog window.
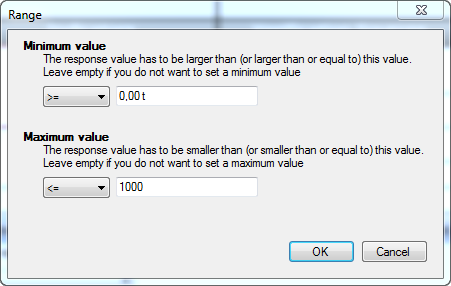
The drop-down list on the left of the value field allows you to specify whether the registered value has to be greater than, greater than or equal to, or equal to the minimum value. For the maximum value, you can set whether the value has to be smaller than, smaller than or equal to, or equal to this value.
You do not need to set both the minimum and maximum value. For instance, if you want to avoid negative values, you can set the minimum value to greater than or equal to zero.
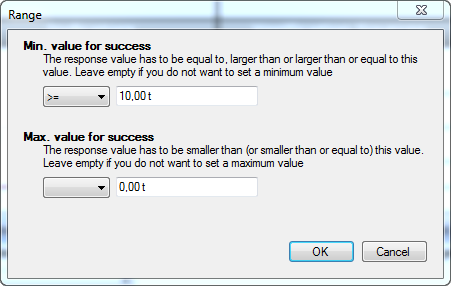
Setting a target
More often than not, you'll have a target to achieve. By clicking on the button, or double-clicking on the target cell in the table, you will get a similar dialog to the one used for setting the range.
Percentage values
If you select 'Percentage' as the question type, you get almost exactly the same window. The difference is that there is no Units column, and that all values are expressed as a percentage.
Multiple choice / multiple options
Multiple choice and multiple options questions allow you to identify a series of standard responses from which your respondent or interviewer/observer can choose from. With multiple choice, you can only select only one of the options. With multiple options, you can select more than one option at a time.
Working with classes
Modifying the class names (column headers)
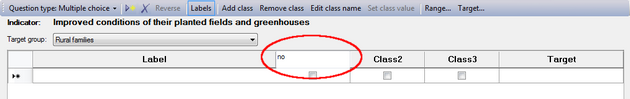
When you set the Question type to 'Multiple choice', you will get an empty table with three classes, called 'Class 1', 'Class 2' and 'Class 3'. To change these column headers, just click somewhere in the column, and then on the button. You can also double-click on the column header. This will make a text field appear, where you can modify the name of this class (column).
Adding and removing classes
If you want to add a class (column), click in the column to the right of where you want to insert it. For instance in the example above, if you want to add a column between Class 2 and Class 3, you should click in the Class 3 column. Then press the button in the toolbar.
If you want to remove a class (column), click in the column itself and then on the button.
Add questions and indicate the preferential answer
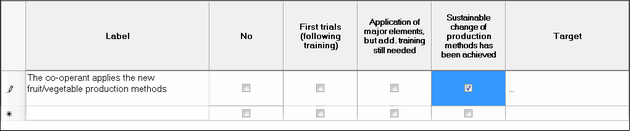
Go to the first row and enter the first question in the 'Label' column. Then you can indicate what would be the correct or preferred answer from your respondents, by clicking in that column. A check mark will appear.
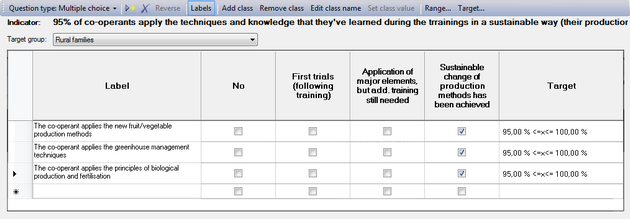
Setting the target of a multiple choice/options question
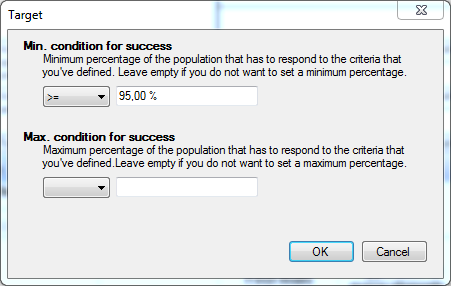
You can set the target in terms of how many beneficiaries out of the total group (population) will achieve this target. Click on the button, or double-click on the target cell in the table to open the following dialog window:
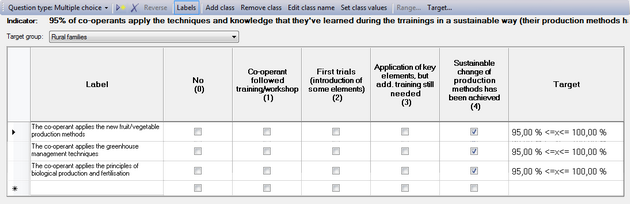
Setting class values
If you want, you can give every class a number to facilitate the registration of results. You can use these values in a different way too, to give points or scores as in the example below: if the co-operant has only introduced some elements of what he/she learned on a training, he/she will get 1 or 2. If she/he rely applies what she/he has learned, then the score will be 3 or 4.
Click on the  button to open the following dialog:
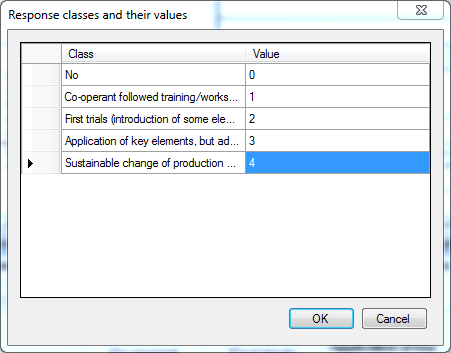
In the first column, you can see the class names (the text that appears in the column headers). In the second column you can enter any value you want.
When you press the < OK > button, you will see these values appear in the column headers between brackets, below the text, as in this example:
Yes/No questions
Some questions can be answered by a simple yes or no. This type of question is easy to use, and a series of yes/no questions can be used to measure more complicated indicators. For each question, you can indicate the correct answer, and you can also set a target in terms of what percentage of the population should get it right.
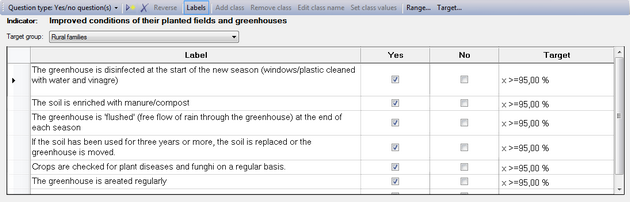
Add questions and indicate the preferential answer
Go to the first row and enter the first question in the 'Label' column. Then you can indicate what would be the correct or preferred answer from your respondents, by clicking in that column. A check mark will appear.
Set the target
You can set the target in terms of how many beneficiaries out of the total group (population) will achieve this target. Click on the button, or double-click on the target cell in the table to open the following dialog window:
Ranking questions
With ranking questions, you present the respondent with a number of options, and ask him or her to indicate which one is the most important, second most important, third most important (and so on).
Working with classes
Modifying the class names (column headers)
When you set the Question type to 'Ranking', you will get an empty table with three classes, called 'Class 1', 'Class 2' and 'Class 3'. To change these column headers, just click somewhere in the column, and then on the button. You can also double-click on the column header. This will make a text field appear, where you can modify the name of this class (column).
Adding and removing classes
If you want to add a class (column), click in the column to the right of where you want to insert it. Then press the button in the toolbar.
If you want to remove a class (column), click in the column itself and then on the button.
Add questions and indicate your preferential ranking
To add questions, go to the first row and enter the questions in the 'Label' column.
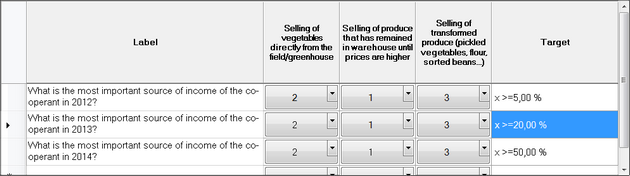
If you want, you can indicate the preferential ranking, meaning the ranking that you hope to achieve by the end of the project (or any other period of time). For instance, in the example below, most people sell their produce immediately when it's harvested. This means that often they don't get a good price, because at harvest time there are a lot of producers offering their vegetables and so on at the same time, so prices are low. It would be better to sell them when there aren't many vegetables around, but that means you have to keep them in a warehouse or freezer. Another option to add value is to transform them into something that has more value (soup or sauce or canned vegetables...)
So when we ask the producers before the project starts what the most important source of income is, they may rank it as follows:
- Selling of vegetables directly from the field/greenhouse
- Selling of transformed produce
- Selling of produce that has remained in the warehouse until prices are higher
What you hope to see in the end is that a certain percentage of producers have changed this order around to:
- Selling of produce that has remained in the warehouse until prices are higher
- Selling of vegetables directly from the field/greenhouse
- Selling of transformed produce
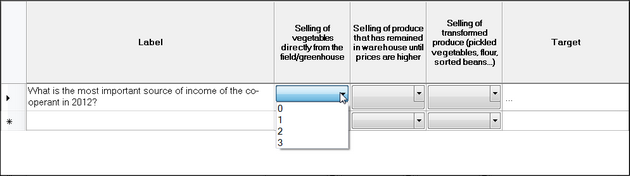
To set the preferential ranking, just click on the drop-down list and select any of the values. You can also click on the cell and type the value. The minimum value is zero, the maximum value is equal to the number of classes (columns).
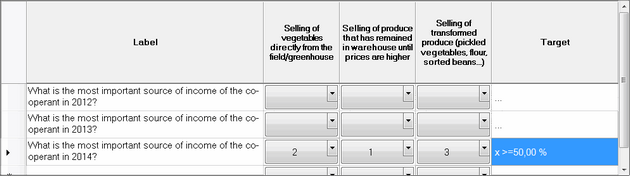
Set the target of a ranking question
You can set the target in terms of how many beneficiaries out of the total group (population) will achieve this target. Click on the button, or double-click on the target cell in the table to open the following dialog window:
You can set out a preferential ranking that you would like to achieve by the end of the project, and indicate per year how your beneficiaries will evolve towards that target, as in the example below:
Best/worst scaling or MaxDiff scales
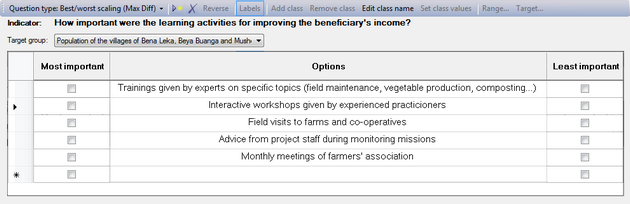
When you use best/worst scaling or MaxDiff scaling (Maximum differential), you present the respondent with a number of options. Then you ask him or her to indicate which one in his/her opinion is the most important (or the best), and which on is the least important (or the worst).
Compared to other rating scales, best/worst scaling pushes people to make a clear-cut choice between a number of options. Instead of asking people to choose the best out of one pair and then move on to the next pair and the next until you've got a definite choice, this kind of scaling allows the respondents to choose directly from a whole set, which makes it easier to use and to take a decision. Another benefit from MaxDiff scaling is that there are no numbers involved, people just have to indicate the best and the worst choice in their opinions.
Modifying the class names (column headers)
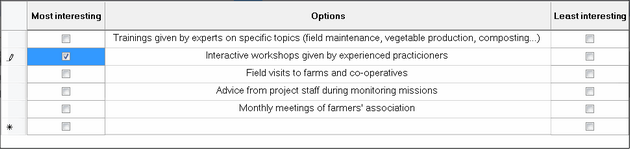
When you set the Question type to 'Best/worst scaling (MaxDiff)', you will get an empty table with an Options column in the middle, with a check box column on either side. By default, Logframer will indicate the column on the left 'Most important' and the one on the right with 'Least important'.
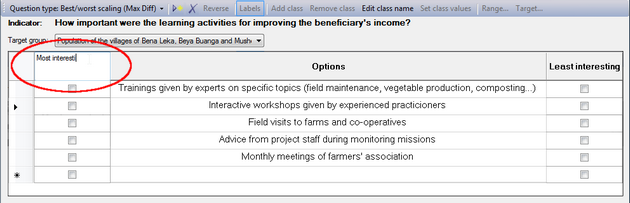
You can change the headers of these columns any way you want. To do this, click somewhere in the column, and then on the button. You can also double-click on the column header itself. This will make a text field appear, where you can modify the header of this column.
Add questions and indicate your preferential ranking
To add questions, click in an empty cell in the 'Options' column in the middle and enter your text.
If you want, you can also indicate the preferential ranking, for one or both selection columns, to indicate the ranking that you hope to achieve by the end of the project (or any other period of time).
Thurstone scale (method of equal-appearing intervals)
The method of equal-appearing intervals or the Thurstone scale is used to measure attitudes of people. Logframer allows you to use a Thurstone scale to measure an indicator, but developing such a scale is not so simple.
This kind of scale is used to measure people's attitude towards a fairly clear and unidimensional concept, using a number of statements that vary in how they express a positive or negative opinion about the main concept. We'll briefly explain the steps of developing a Thurstone scale:
- Determine the focus: what concept are you going to measure (see what people's attitudes are toward it)?
- Ask a group of people (or a person) to write down different statements about this concept, reflecting different opinions or attitudes about the subject. Make sure you have a large number of statements, making sure that people can either degree or disagree with them (no - open - questions for instance).
- Rating the scale items: the next step is to have your group rate each statement on a 1-to-11 scale in terms of how much each statement indicates a favourable attitude towards the concept. The members of the group must not express their own opinion, they must only indicate how favourable they feel each statement is. You can use a scale with 1 = extremely favourable attitude towards the subject (focus) and 11 = extremely unfavourable attitude towards the subject.
- Compute the median and interquartile range for each statement. Create a table with these values and sort by the median.
- Select the items for the actual scale: you should select statements that are at equal intervals across the range of medians. Within each value, you should try to select the statement that has the smallest Interquartile Range. This is the statement with the least amount of variability across judges. You don't want the statistical analysis to be the only deciding factor here. Look over the candidate statements at each level and select the statement that makes the most sense. If you find that the best statistical choice is a confusing statement, select the next best choice.
For a detailed example, see http://www.socialresearchmethods.net/kb/scalthur.php
You can now use the scale to measure attitudes 'in the field': enter the list of statements and use them to interview people or present them in a document. For each item, they should express whether they agree or disagree. The total score of a person is calculated by making the sum of the values of all the statements they agreed with, divided by the number of items he agreed on (in other words, the average of the statements they agreed with).
Modifying the class names (column headers)
When you set the Question type to 'Scale (Thurstone)', you will get an empty table with the usual 'Labels' column, and two classes: 'Agree' and 'Disagree'. You can change the headers of these columns any way you want, but make sure that the second column remains the favourable option and the last column the unfavourable option.
To change the column headers, click somewhere in the column, and then on the button. You can also double-click on the column header itself. This will make a text field appear, where you can modify the header of this column.
Add statements
To add the statements that make up your scale, go to the first row and enter them in the 'Label' column.
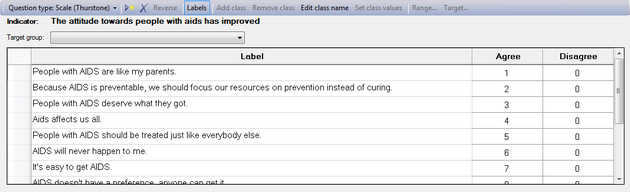
Every time you add a statement, you will see a value appear in the 'Agree' column (second column). The first statement will get 1, the second 2 and so on. In other words, Logframer assumes that the first statement is the first one on your scale and so on. But if you want to randomize your statements and use different values than the ones that are generated automatically you can do so.
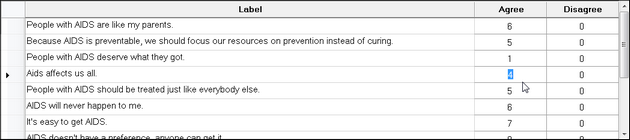
Modifying the values of the favourable answers ('Agree' column)
If you want to change the values that are automatically inserted when you add a new statement, just click on the cell and type another value of your scale. You can only modify the 'Agree' column, not the 'Disagree' column.
Likert scale (summative scale)
The Likert scale can also be used to measure attitudes of people. When responding to a Likert questionnaire item, respondents specify their level of agreement or disagreement on a symmetric agree-disagree scale for a series of statements. Thus, the range captures the intensity of their feelings for a given item. As with the Thurstone scale, the development of a Likert scale takes some effort.
A Likert scale uses a number of Likert items, which are statements to which a respondent expresses his agreement or disagreement. Generally, a five-point or seven-point scale is used, for instance:
|
Strongly agree |
Agree |
Neutral |
Disagree |
Strongly disagree |
As you can see, each item is bipolar: it measures either someone's agreement or disagreement to the statement and allows you to give some measure of how much you agree or disagree. There are a variety possible response scales (1-to-7, 1-to-9, 0-to-4). All of these odd-numbered scales have a middle value is often labelled Neutral or Undecided. It is also possible to use a forced-choice response scale with an even number of responses and no middle neutral or undecided choice. In this situation, the respondent is forced to decide whether they lean more towards the agree or disagree end of the scale for each item.
The basic steps of developing a Likert scale are:
- Determine the focus: what concept are you going to measure (see what people's attitudes are toward it)?
- Ask a group of people (or a person) to write down different statements about this concept, reflecting different opinions or attitudes about the subject. Make sure you have a large number of statements, making sure that people can express their degree of agreement or disagreement on a five or seven-point scale.
- Rating the scale items: the next step is to have your group rate each statement on your five-point (or seven-point, or 10-point) scale in terms of how much each statement indicates a favourable or unfavourable attitude towards the concept. The members of the group must not express their own opinion, they must only indicate how favourable or unfavourable they feel each statement is. All statements (Likert items) in the Likert scale must use the same number of points on the scale (so either a 5-point scale, or a 7-point scale, but not a mix of the two).
- Select the items for the actual scale: The next step is to compute the intercorrelations between all pairs of items, based on the ratings of the judges. In making judgements about which items to retain for the final scale there are several analyses you can:
- Throw out any items that have a low correlation with the total (summed) score across all items
- For each item, get the average rating for the top quarter of judges and the bottom quarter. Then, do a t-test of the differences between the mean value for the item for the top and bottom quarter judges.
Correlation between the items and the total score: In most statistics packages it is relatively easy to compute this type of Item-Total correlation. First, you create a new variable which is the sum of all of the individual items for each respondent. Then, you include this variable in the correlation matrix computation (if you include it as the last variable in the list, the resulting Item-Total correlations will all be the last line of the correlation matrix and will be easy to spot). How low should the correlation be for you to throw out the item? There is no fixed rule here -- you might eliminate all items with a correlation with the total score less that .6, for example.
T-test: Higher t-values mean that there is a greater difference between the highest and lowest judges. In more practical terms, items with higher t-values are better discriminators, so you want to keep these items. In the end, you will have to use your judgement about which items are most sensibly retained. You want a relatively small number of items on your final scale (e.g., 10-15) and you want them to have high Item-Total correlations and high discrimination (e.g., high t-values).
For a detailed example, see http://www.socialresearchmethods.net/kb/scallik.php
You can now use the scale to measure attitudes 'in the field': enter the list of statements and use them to interview people or present them in a document. For each item, they should express to what degree they agree or disagree. The final score for the respondent on the scale is the sum of their ratings for all of the items (this is why this is sometimes called a summative scale). On some scales, you will have items that are reversed in meaning from the overall direction of the scale. These are called reversal items. You will need to reverse the response value for each of these items before summing for the total. That is, if the respondent gave a 1, you make it a 5; if they gave a 2 you make it a 4; 3 = 3; 4 = 2; and, 5 = 1.
Working with classes
Modifying the class names (column headers)
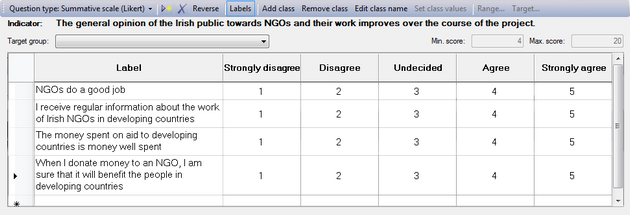
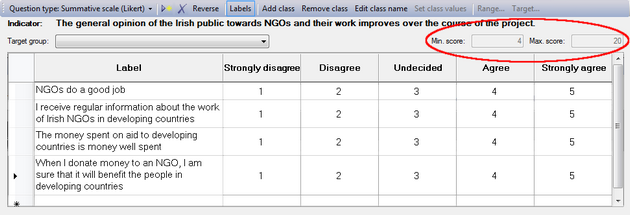
When you set the Question type to 'Summative scale (Likert)', you will get an empty table with the 'Labels' column on the left, and by default five classes:

To change the column headers, click somewhere in the column, and then on the button. You can also double-click on the column header itself. This will make a text field appear, where you can modify the header of this column.
Adding and removing classes
If you want to add a class (column), click in the column to the right of where you want to insert it. Then press the button in the toolbar.
If you want to remove a class (column), click in the column itself and then on the button.
Add statements
To add the statements that make up your scale, go to the first row and enter them in the 'Label' column.
Reversing the scores/values
Logframer will number the cells of the scale from 1 to the number of columns/classes. For instance, when you have a five-item scale, the cells will be numbered from 1 to 5. You can use these numbers to count how many people have made a particular choice. Or you can use the values as scores, and calculate how well your project has done in comparison to a situation where all the beneficiaries have the maximum or minimum score (depending on whether the preferential choice is 1 or 5). The maximum and minimum scores are indicated on the right, above the table.
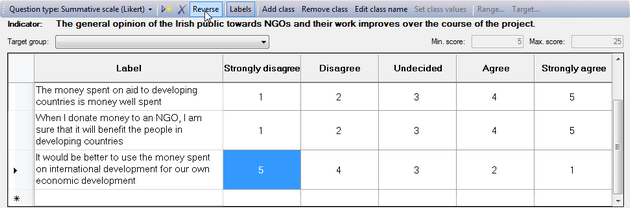
If you want to reverse the order of these scores, you can click on the  button. Instead of 1-2-3-4-5, you will get 5-4-3-2-1.
Modifying the values of the favourable answers
If you want to change the values that are automatically inserted when you add a new statement, just click on the cell and type any other value for your scale.
Cumulative scale (Guttman scale)
The cumulative scale or Guttman scale measures to what degree a person has a positive or negative attitude to something. It makes use of a series of statements that are growing or descending in how positive or negative a person is towards the subject. If for instance on a scale with seven statements the respondent agrees with the fifth statement, it implies that he or she also agrees with the first four statements, but not with statement number six and seven.
To create a Guttman scale, you need to:
- Determine the focus: what concept are you going to measure (see what people's attitudes are toward it)?
- Ask a group of people (or a person) to write down different statements about this concept, reflecting different opinions or attitudes about the subject. Make sure you have a large number of statements, making sure that people can either degree or disagree with them (no - open - questions for instance).
- Rating the scale items: the next step is to have your judges rate each statement, indicating whether the statement expresses a positive (favourable) or negative (unfavourable) attitude towards the concept. The members of the group must not express their own opinion about the concept, they must only indicate whether the statement is favourable or unfavourable.
- Developing the scale: construct a matrix or table that shows the responses of all the respondents on all of the items. Then sort this matrix so that respondents who agree with more statements are listed at the top and those agreeing with fewer are at the bottom. For respondents with the same number of agreements, sort the statements from left to right from those that most agreed to those that fewest agreed to.
- If there are lots of items, you need to use a data analysis called scalogram analysis to determine the subsets of items from our pool that best approximate the cumulative property. Then review these items and select the final scale elements. There are several statistical techniques for examining the table to find a cumulative scale.
- Because there is seldom a perfectly cumulative scale you usually have to test how good it is. These statistics also estimate a scale score value for each item. This scale score is used in the final calculation of a respondent's score.
For a detailed example, see http://www.socialresearchmethods.net/kb/scalgutt.php
You can now use the scale to measure attitudes 'in the field': enter the list of statements and use them to interview people or present them in a document. For each item, they should express whether they agree or disagree. Each scale item has a scale value associated with it (obtained from the scalogram analysis). To compute a respondent's scale score we simply sum the scale values of every item they agree with.
Modifying the class names (column headers)
When you set the Question type to 'Cumulative scale (Guttman)', you will get an empty table with the usual 'Labels' column, and two classes: 'Agree' and 'Disagree'. You can change the headers of these columns any way you want, but make sure that the second column remains the favourable option and the last column the unfavourable option.
To change the column headers, click somewhere in the column, and then on the button. You can also double-click on the column header itself. This will make a text field appear, where you can modify the header of this column.
Add statements
To add the statements that make up your scale, go to the first row and enter them in the 'Label' column.

Every time you add a statement, you will see a '1' appear in the 'Agree' column (second column). If you want, you can modify this score but you can only modify the value in the 'Agree' column and not in the 'Disagree' column.
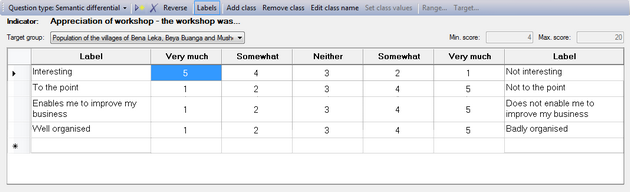
Semantic differential
A semantic differential is useful to measure what the attitude is of the respondent towards something. In a semantic differential, you have two opposing characteristics at either end of a scale (also called a bipolar pair). This scale in the middle typically has five or seven items. When the number of items on the scale is uneven, the middle one expresses a neutral point between the two extremes. But this is not necessarily so, you can also have a scale with an even number of items - sometimes up to ten items are used in the scale.
Working with classes
Modifying the class names (column headers)
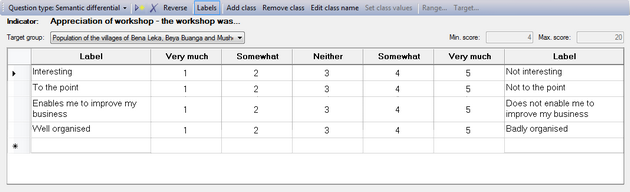
When you select 'Semantic differential' as the Question type, you will get an empty table with two label columns at either end, and a five-item scale in the middle:
|
Very much |
Somewhat |
Neither |
Somewhat |
Very much |
To change these column headers, just click somewhere in the column, and then on the button. You can also double-click on the column header. This will make a text field appear, where you can modify the name of this class (column).
Adding and removing classes
If you want to add a class (column), click in the column to the right of where you want to insert it. Then press the button in the toolbar.
If you want to remove a class (column), click in the column itself and then on the button.
Adding pairs and changing scores
Adding bipolar pairs
To add questions, go to the first row and enter the pairs in the 'Label' columns at the left and right of the table. The easiest way to come up with a bipolar pair is to write a word or concept in the first column, and to copy it in the last column and put 'not' in front.
Reversing the scores/values
Logframer will number the cells of the scale from 1 to the number of columns/classes. For instance, when you have a five-item scale, the cells will be numbered from 1 to 5. You can use these numbers to count how many people have chosen a particular column. Or you can use the values as scores, and calculate how well your project has done in comparison to a situation where all the beneficiaries have the maximum or minimum score (depending on whether the preferential choice is 1 or 5). The maximum and minimum scores are indicated on the right, above the table.
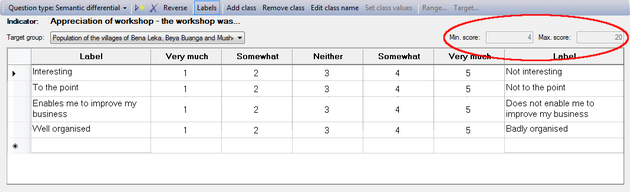
If you want to reverse the order of these scores, you can click on the button. Instead of 1-2-3-4-5, you will get 5-4-3-2-1.
How can the information be verified?
Click on an item in the Verification sources column to get the window shown below:
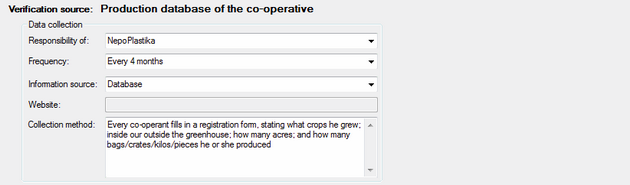
Here you can indicate how the data will be collected, and who will be responsible for the collection of this information.
- To indicate who is responsible for the data collection, you can select any of your partners from the drop-down list.
- Next, you can indicate the frequency at which the data collection should happen: weekly, monthly, every 3-4-6 months, yearly, at the start or at the end of the project, mid-term, before the project starts (ex ante) or after the project (ex post).
- In the third text box, you can indicate what kind of information source you're using: a baseline study, registration forms, follow-up missions, meetings, etc.
- If you've selected a website as your information source in the previous box, you can enter the site's URL in the Website box.
- Finally, you can provide a bit more information about the collection method.
Assumptions: assessing the risk and formulating a response
When you click on an assumption in the logframe window, you can provide information about the kind of risk you may have to deal with, its likelihood and potential impact, and how you will deal with that risk should it occur. On the left side of the details window you can indicate how important you think that risk is. On the right side, you can explain what your approach is to dealing with this risk.
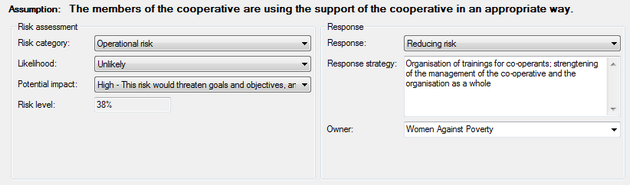
Risk assessment
First you can indicate what kind of risk this is: an operational risk; a financial risk; a risk for your objectives; a risk for your reputation; or another kind of risk.
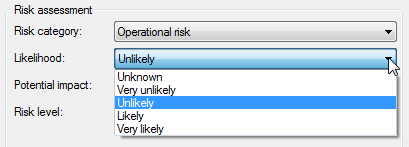
Then you can indicate how serious you think this risk is, using two parameters. First, you assess how likely it is that this risk will occur in the course of your project. You can select one of four degrees of likelihood by clicking on the drop-down list:
Then you indicate what the impact would be should this risk occur:
- The impact is unknown
- The impact would be very low: routine procedures would be sufficient to deal with the consequences should this risk occur
- The impact would be low: this risk could threaten goals and objectives, and thus may require constant monitoring
- The impact would be high: if it occurs, this risk would threaten the achievement of goals and objectives, and thus may require review of the entire project
- The impact would be very high: when this risk occurs, it would prevent achievement of goals and objectives.
Once you've indicated the likelihood and the potential impact of the risk, Logframer will calculate the Risk level percentage.
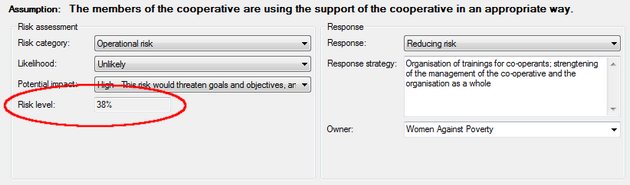
Risk response
At the right side of the window, you can indicate how you will react should the risk eventually occur:
- Trying to avoid the risk altogether
- Trying to reduce the risk or its effects should it occur
- Sharing the risk with others
- Transferring the risk to others
- Accepting the risk
Below the response, you can write down what exactly will be your approach or response strategy once the risk occurs. Finally, you can also indicate which of the partners is ultimately responsible for dealing with the risk.
Detailing budget items
To specify how much a certain resource will cost, you can enter a single value in the Budget column of the logframe window. Alternatively, you can specify any number of items in the Details window. Logframer will calculate the total cost of these different items, and show this total amount in the Budget column.
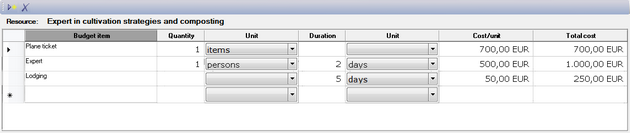
For each item you can specify:
- The quantity
- The duration, if necessary
- The cost per unit
You needn't fill out all three fields if you don't want to. You can either:
- Specify the unit cost only (for instance if you want to indicate a lump sum).
- Specify the quantity and the unit cost
- Specify the duration and the unit cost (for instance to calculate salaries).
- Specify the quantity, the duration and the unit cost.
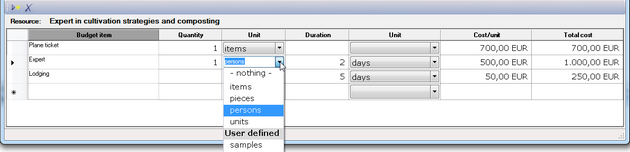
If you want to specify the number unit, you can select a standard item from the drop-down list. Alternatively, you can enter any indication in the Unit column. The text you entered will be added to the bottom of the drop-down list, in the User-defined section.
All prices/costs are shown in a standard currency (in this example in Euros). If you want to change the default currency for your logframe, go to Tools → Options in the Menu bar and select a currency from the drop-down list of the Currency (budget) field.