Getting an overview of the activities of the current output
When you have a number of activities, some of which are linked to others and some of which may need preparation time, or follow-up afterwards, or may have to be repeated, it can become difficult to keep track.
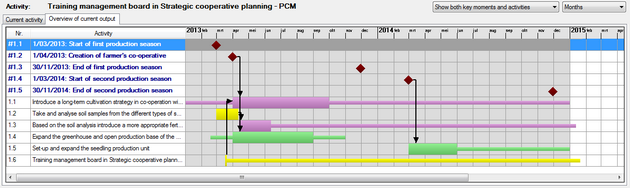
When you click on the Overview of current output tab, you will get an overview of all the activities of the current output in the form of a Gantt-chart.
The two drop-down lists at the top right allow you to manipulate the view of this Gantt chart.
- You can choose to see the activities only, or both the activities and the key moments that you have identified for this output.
- You can change the level of detail to days, weeks, months or years.
On the left, you can see the list of key moments (shown first in blue) and activities. On the right, you can see the actual Gantt chart:
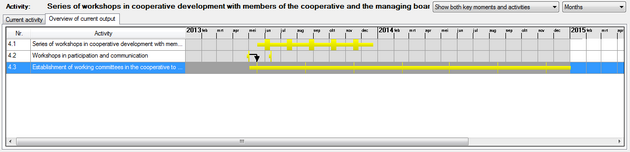
- The duration of each activity is shown as a horizontal bar. The activity itself takes up the whole height of the row (thick part). The preparation time and the follow-up period are shown as thinner lines before and after the activity itself.
- Each type of activity has another colour (here purple is related to planning, green is construction, yellow has to do with capacity development)
- The black arrows show which activities are linked to key moments (the red diamonds), or to other activities.
Alternatively, if you want to have an overview of the activities and/or key moments of all the outputs - or in other words the complete planning of your project - you can open the Planning window.