Likert scale (summative scale)
The Likert scale can also be used to measure attitudes of people. When responding to a Likert questionnaire item, respondents specify their level of agreement or disagreement on a symmetric agree-disagree scale for a series of statements. Thus, the range captures the intensity of their feelings for a given item. As with the Thurstone scale, the development of a Likert scale takes some effort.
A Likert scale uses a number of Likert items, which are statements to which a respondent expresses his agreement or disagreement. Generally, a five-point or seven-point scale is used, for instance:
|
Strongly agree |
Agree |
Neutral |
Disagree |
Strongly disagree |
As you can see, each item is bipolar: it measures either someone's agreement or disagreement to the statement and allows you to give some measure of how much you agree or disagree. There are a variety possible response scales (1-to-7, 1-to-9, 0-to-4). All of these odd-numbered scales have a middle value is often labelled Neutral or Undecided. It is also possible to use a forced-choice response scale with an even number of responses and no middle neutral or undecided choice. In this situation, the respondent is forced to decide whether they lean more towards the agree or disagree end of the scale for each item.
The basic steps of developing a Likert scale are:
- Determine the focus: what concept are you going to measure (see what people's attitudes are toward it)?
- Ask a group of people (or a person) to write down different statements about this concept, reflecting different opinions or attitudes about the subject. Make sure you have a large number of statements, making sure that people can express their degree of agreement or disagreement on a five or seven-point scale.
- Rating the scale items: the next step is to have your group rate each statement on your five-point (or seven-point, or 10-point) scale in terms of how much each statement indicates a favourable or unfavourable attitude towards the concept. The members of the group must not express their own opinion, they must only indicate how favourable or unfavourable they feel each statement is. All statements (Likert items) in the Likert scale must use the same number of points on the scale (so either a 5-point scale, or a 7-point scale, but not a mix of the two).
- Select the items for the actual scale: The next step is to compute the intercorrelations between all pairs of items, based on the ratings of the judges. In making judgements about which items to retain for the final scale there are several analyses you can:
- Throw out any items that have a low correlation with the total (summed) score across all items
- For each item, get the average rating for the top quarter of judges and the bottom quarter. Then, do a t-test of the differences between the mean value for the item for the top and bottom quarter judges.
Correlation between the items and the total score: In most statistics packages it is relatively easy to compute this type of Item-Total correlation. First, you create a new variable which is the sum of all of the individual items for each respondent. Then, you include this variable in the correlation matrix computation (if you include it as the last variable in the list, the resulting Item-Total correlations will all be the last line of the correlation matrix and will be easy to spot). How low should the correlation be for you to throw out the item? There is no fixed rule here -- you might eliminate all items with a correlation with the total score less that .6, for example.
T-test: Higher t-values mean that there is a greater difference between the highest and lowest judges. In more practical terms, items with higher t-values are better discriminators, so you want to keep these items. In the end, you will have to use your judgement about which items are most sensibly retained. You want a relatively small number of items on your final scale (e.g., 10-15) and you want them to have high Item-Total correlations and high discrimination (e.g., high t-values).
For a detailed example, see http://www.socialresearchmethods.net/kb/scallik.php
You can now use the scale to measure attitudes 'in the field': enter the list of statements and use them to interview people or present them in a document. For each item, they should express to what degree they agree or disagree. The final score for the respondent on the scale is the sum of their ratings for all of the items (this is why this is sometimes called a summative scale). On some scales, you will have items that are reversed in meaning from the overall direction of the scale. These are called reversal items. You will need to reverse the response value for each of these items before summing for the total. That is, if the respondent gave a 1, you make it a 5; if they gave a 2 you make it a 4; 3 = 3; 4 = 2; and, 5 = 1.
Working with classes
Modifying the class names (column headers)
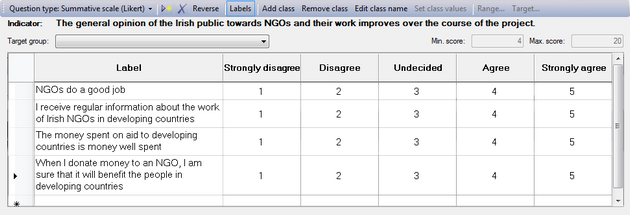
When you set the Question type to 'Summative scale (Likert)', you will get an empty table with the 'Labels' column on the left, and by default five classes:

To change the column headers, click somewhere in the column, and then on the  button. You can also double-click on the column header itself. This will make a text field appear, where you can modify the header of this column.
Adding and removing classes
If you want to add a class (column), click in the column to the right of where you want to insert it. Then press the  button in the toolbar.
If you want to remove a class (column), click in the column itself and then on the  button.
Add statements
To add the statements that make up your scale, go to the first row and enter them in the 'Label' column.
Reversing the scores/values
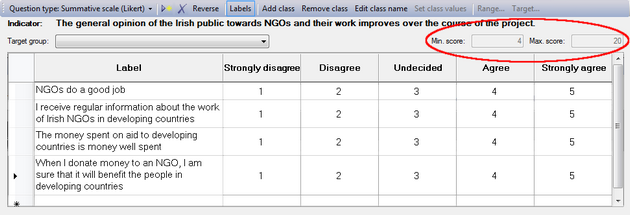
Logframer will number the cells of the scale from 1 to the number of columns/classes. For instance, when you have a five-item scale, the cells will be numbered from 1 to 5. You can use these numbers to count how many people have made a particular choice. Or you can use the values as scores, and calculate how well your project has done in comparison to a situation where all the beneficiaries have the maximum or minimum score (depending on whether the preferential choice is 1 or 5). The maximum and minimum scores are indicated on the right, above the table.
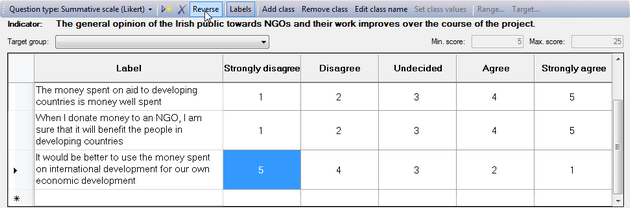
If you want to reverse the order of these scores, you can click on the  button. Instead of 1-2-3-4-5, you will get 5-4-3-2-1.
Modifying the values of the favourable answers
If you want to change the values that are automatically inserted when you add a new statement, just click on the cell and type any other value for your scale.