Likert scale
The difference between a full-blown Likert scale and a Likert-type scale is that the Likert-type scale only uses a five-point (or seven-point, or whatever you prefer) to answer on a single question. A full-blown Likert scale on the other hand uses a series of statements that explore different dimensions of a subject.
The Likert scale can also be used to measure attitudes of people. When responding to a Likert questionnaire item, respondents specify their level of agreement or disagreement on a symmetric agree-disagree scale for a series of statements. Thus, the range captures the intensity of their feelings for a given item. As with the Thurstone scale, the development of a Likert scale takes some effort.
A Likert scale uses a number of Likert items, which are statements to which a respondent expresses his agreement or disagreement. Generally, a five-point or seven-point scale is used, for instance:
- Strongly agree
- Agree
- Neutral
- Disagree
- Strongly disagree
As you can see, each item is bipolar: it measures either someone's agreement or disagreement to the statement and allows you to give some measure of how much you agree or disagree. There is a variety of possible response scales (5-point; 7-point; 4-point…). All of these odd-numbered scales have a middle value is often labelled ‘Neutral’ or ‘Undecided’. It is also possible to use a forced-choice response scale with an even number of responses and no central neutral choice. In this situation, the respondent is forced to decide whether they lean more towards the agree or disagree end of the scale for each item.
The basic steps of developing a Likert scale are:
- Determine the focus: what concept are you going to measure (see what people's attitudes are toward it)?
- Ask a group of people (or a person) to write down different statements about this concept, reflecting different opinions or attitudes about the subject. Make sure you have a large number of statements, making sure that people can express their degree of agreement or disagreement on a five or seven-point scale.
- Rating the scale items: the next step is to have your group rate each statement on your five-point (or seven-point, or 10-point) scale in terms of how much each statement indicates a favourable or unfavourable attitude towards the concept. The members of the group must not express their own opinion, they must only indicate how favourable or unfavourable they feel each statement is. All statements (Likert items) in the Likert scale must use the same number of points on the scale (so either a 5-point scale, or a 7-point scale, but not a mix of the two).
- Select the items for the actual scale: The next step is to compute the intercorrelations between all pairs of items, based on the ratings of the judges. In making judgements about which items to retain for the final scale there are several analyses you can:
- Throw out any items that have a low correlation with the total (summed) score across all items
- For each item, get the average rating for the top quarter of judges and the bottom quarter. Then, do a T-test of the differences between the mean value for the item for the top and bottom quarter judges.
- Correlation between the items and the total score: In most statistics packages it is relatively easy to compute this type of Item-Total correlation. First, you create a new variable which is the sum of all of the individual items for each respondent. Then, you include this variable in the correlation matrix computation (if you include it as the last variable in the list, the resulting Item-Total correlations will all be the last line of the correlation matrix and will be easy to spot). How low should the correlation be for you to throw out the item? There is no fixed rule here -- you might eliminate all items with a correlation with the total score less than .6, for example.
- T-test: Higher t-values mean that there is a greater difference between the highest and lowest judges. In more practical terms, items with higher t-values are better discriminators, so you want to keep these items. In the end, you will have to use your judgement about which items are most sensibly retained. You want a relatively small number of items on your final scale (e.g., 10-15) and you want them to have high Item-Total correlations and high discrimination (e.g., high t-values).
- For a detailed example, see http://www.socialresearchmethods.net/kb/scallik.php
You can now use the scale to measure attitudes in the field: enter the list of statements and use them to interview people or present them in a document. For each item, they should express to what degree they agree or disagree.
The final score for the respondent on the scale is the sum of their ratings for all of the items (this is why this is sometimes called a summative scale). On some scales, you will have items that are reversed in meaning from the overall direction of the scale. These are called reversal items. You will need to reverse the response value for each of these items before summing for the total. That is, if the respondent gave a 1, you make it a 5; if they gave a 2 you make it a 4; 3 = 3; 4 = 2; and, 5 = 1.
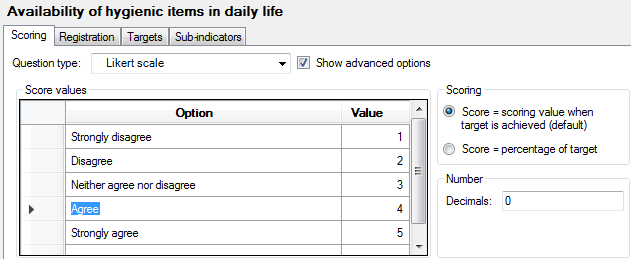
On the Scoring tab:
- Score values box: enter the different Likert scale options that the respondent will be able to choose from. A typical Likert scale has five or seven options (five-point Likert scale or seven-point Likert scale), which means that there is a neutral option in the middle. But you can also use an even number of options and use more or less options than five or seven. For example:
- Strongly disagree – disagree – neutral – agree – strongly agree
- Very good – good – bad – very bad
- Enter a scoring value for each option.
- Scoring: see the page on this topic
- Number box: select the number of decimals for the total scoring value of the baseline/targets.
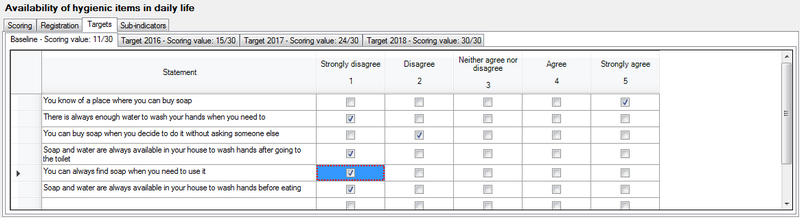
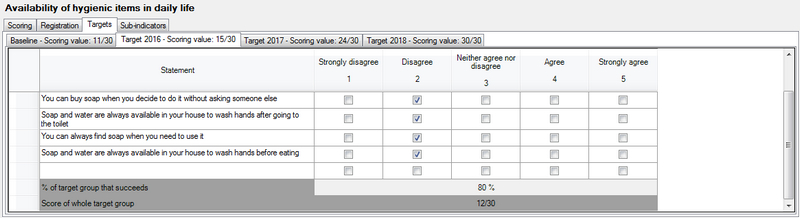
On the Targets tab:
- The Targets tab is divided in another series of tabs: one for the baseline and one for each target
- Add statements in the first column (Statement column). When you enter or modify statements in the Baseline tab they will automatically be copied to the targets.
- Select one of the checkboxes for each statement. The total score for the baseline or target is displayed in the tab header.
- When you measure at beneficiary level, specify which percentage of the target group you expect to reach that target. On the bottom row Logframer will calculate the total scores for the target population.

Recent blog posts
- Website occasionaly down
- Logframer training videos by Atiq Rehman
- Logframer Training at University of Blida (Algeria)
- Update of Logframer 3.1
- Logframer 3.1 is out (y disponible en español)
- Installation problem
- IATI part II – Does IATI provides us with a better understanding of aid flows?
- IATI part I – What is the International Aid Transparency Initiative?
- Logframer by the Numbers - 31000 Downloads and Counting
- Logframer 3.0 preview
Recent comments
- Multi Projects management 4 years 1 month ago
- Font Display Size 4 years 2 months ago
- Adjusting Font Display Size 4 years 2 months ago
- Merci pour cet outil de 4 years 2 months ago
- Thank you! 4 years 2 months ago
- Output, outcome and impact analysis 4 years 5 months ago
- PCM Model of Six Phases 4 years 6 months ago
- Appreciation 4 years 6 months ago
- Adjusting Font Display Size 4 years 10 months ago
- downloading 4 years 11 months ago
User login


Add new comment